
 800-303-8803
Is your Facebook or Instagram ad campaign working? No, this is not a pitch for The Ad Auditor. It’s a question you have to ask of yourself, or the agency you’ve hired to handle your social media advertising. The face, no pun intended, of Ads Manager has changed many times over the years, and can be statistical overload and difficult to navigate even if you’ve been working within the platform for many years. Let’s take a little time to cover the most important statistics that will give you a quick insight into whether your ads are working or if you need to change things up.
 In the above screenshot you see the navigation for Facebook Ads Manager including an overview, campaigns, ad sets, and ads. For the most overall view of your performance you’ll want to be in campaigns, to drill down deeper, feel free to click on any of the ads, but if you have more than one you’ll be able to see everything from the Campaigns screen. At the bottom you’ll see the statistics and other information like end date and whether or not your ads are active under delivery. For this article let’s focus on Results, Reach, Impressions, and Cost per Result.
Results
Let’s start with the simple stuff, results. When the ads are created, a number of objectives are available:
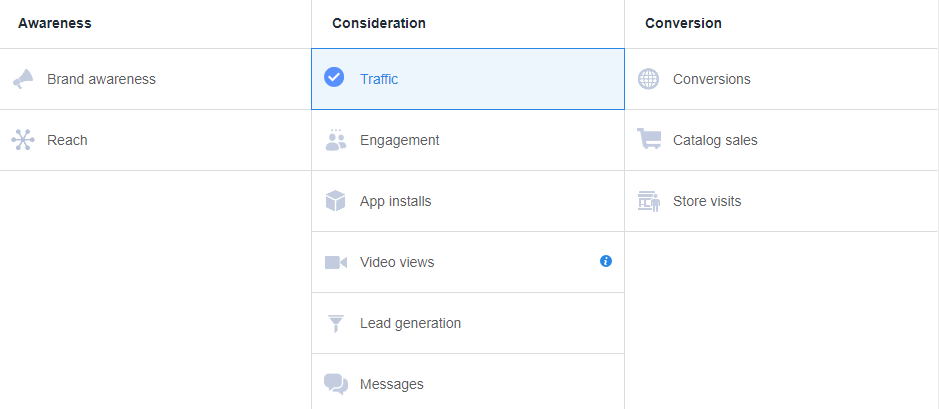
The most common ones are right there in the middle, Traffic, Engagement, and Video Views. Engagement encourages reactions, comments, and shares. Video views, of course, will serve your video as an ad. Traffic, allows for a link with desired call to action button to either a website, app, or Messenger. These will be measured as “Link Clicks” in your statistics.
Let’s deviate a little toward SEO for a minute or two when we talk about link clicks to a website. If you are seeing clicks on your ad but not getting conversions there may be a problem with, or edits may need to be made to your landing page. Some things to consider when it comes to your landing page from a Facebook or Instagram ad that isn’t converting:
- Does the link that is in the ad work? It may sound simple but one missing character can throw off the whole thing.
- Do you have a custom landing page? If not, you should. You got someone to click on your ad, they shouldn’t have to then go searching all over your website for the information or product they wanted.
- Are there clear calls to action on your landing page for the user to complete the desired action?
- Is your contact information easy to find? You can have the greatest product or service in the world but if people have to figure out how to contact you to get it, they will just leave.
- If your traffic is coming from mobile sources are the email and/or phone number fields clickable? If they’re not this is an impediment to contacting your business and again, people will leave. Every try to click between a browser screen and the phone function just to call someone? Pretty annoying isn’t it?
Cost Per Result
This is a fairly straightforward metric. It measures how much it cost you to have someone take the desired action on your ad. The closer you get to $0.01 per result the better, since it will never be $0. In 2017 the average cost per click globally was 97 cents, and in the US was $1.10. So, if you are at $1 or lower your ads are performing at least at an average rate. If you start seeing that number creep above $1 per action, it may be time to consider changing up the ad, or dropping it altogether.
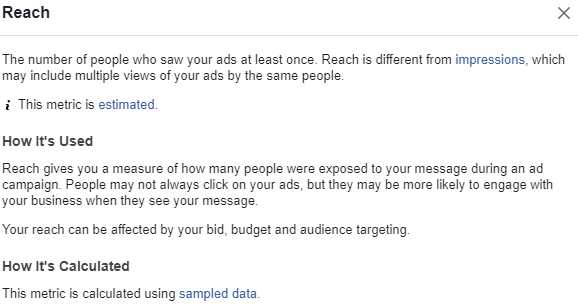
Let’s dive into some murkier water now. Ever since the metrics of Reach and Impressions were introduced people have been asking, what’s the difference between the two?
We’ve included screenshots straight from the source below, but to break it down into much simpler terms. Reach, is the number of people who saw the ad at least once, and impressions are the number of times the ad was seen. Think of it like watching a movie or TV show. I was recently on a cross country flight and watched 2 movies during the trip, Justice League and Thor: Ragnarok. That was the first time (and probably will be the only time) viewing Justice League so the reach for that movie went up by 1 and impressions by 1. That was my 3rd time watching Thor Ragnarok so I’ve contributed 1 to reach and 3 to impressions.
In the Facebook/Instagram world, these numbers are estimates, as there is no concrete way to prove someone saw your ad. Facebook admits this in their explanation, but those statistics still provide a good reference.
One last set of statistics you’ll want to pay attention to are found under the Breakdown menu.
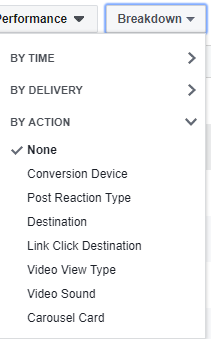
The two that are the most important as far as making adjustments to your ad are Conversion Device and Carousel Card. You can have more than one link destination but, chances are you’re only focused on one so, let’s assume that’s the case for our purposes.
Conversion Device
There’s a couple things to consider here, one has to do with budget, and the other we discussed earlier, your landing page. If you’re ad is for an app and you see 10 people from an iOS device for every 1 from an Android clicking your ad, you may want to consider pushing some budget toward iOS to drive down your cost per action.
We recently had a client start a campaign for clicks to a website, and within the first 5 days 100% of their clicks came from an Android Smartphone. With that in mind we suggested some changes to optimize their landing page for mobile users. This was completely opposite of what we would have expected to see, given the nature of their industry. Without doing the research, this could have cost them a number of conversions. The clicks probably would have remained the same, but the desired end actions probably weren’t going to be taken with the original design.
Carousel Card
When used properly carousel ads can be quite effective. If there’s not a common thread between all of your imagery, stick to single images or videos. Like knowing what conversion device was used, know what card in your carousel people clicked on can be very telling.
On Facebook and Instagram you can have up to 3 images (with the option of your logo as a 4th) in your carousel ad. If you’re seeing an even number of clicks across all 3, or seeing a majority come from your final card, you’re in good shape. Your images are likely compelling and tell a story that makes the user click the way through. It’s not necessarily bad if the majority of clicks come from the #1 or #2 position, but that can indicate something else that we’ll discuss next.
If your copy and early images are captivating enough to convince someone to click on slide 1 or 2 great! You should aim to have great looking images across the entire carousel. Like we said earlier, what you’ll need to pay attention to are your end conversions. If a ton of people are clicking on slide 1 and then bouncing off of your landing page, there’s a disconnect in the visual or the message of the ad and the content of the landing page.
Hopefully this cleared up some things for you when it comes to looking at reports on your social media ads. Still need a little help? Reach out to us and we’ll connect you with one of our social media specialists.

